TL;DR(Too Long; Did not Read)
Real 2026 benchmarks on how Swiss mid-market firms measure AI automation ROI: payback periods, time savings, cost per task, and CFO-grade metrics.
How Do Swiss Mid-Market Companies Measure ROI from AI Automation? Real Benchmarks from 2026 Deployments
Quick Answer:
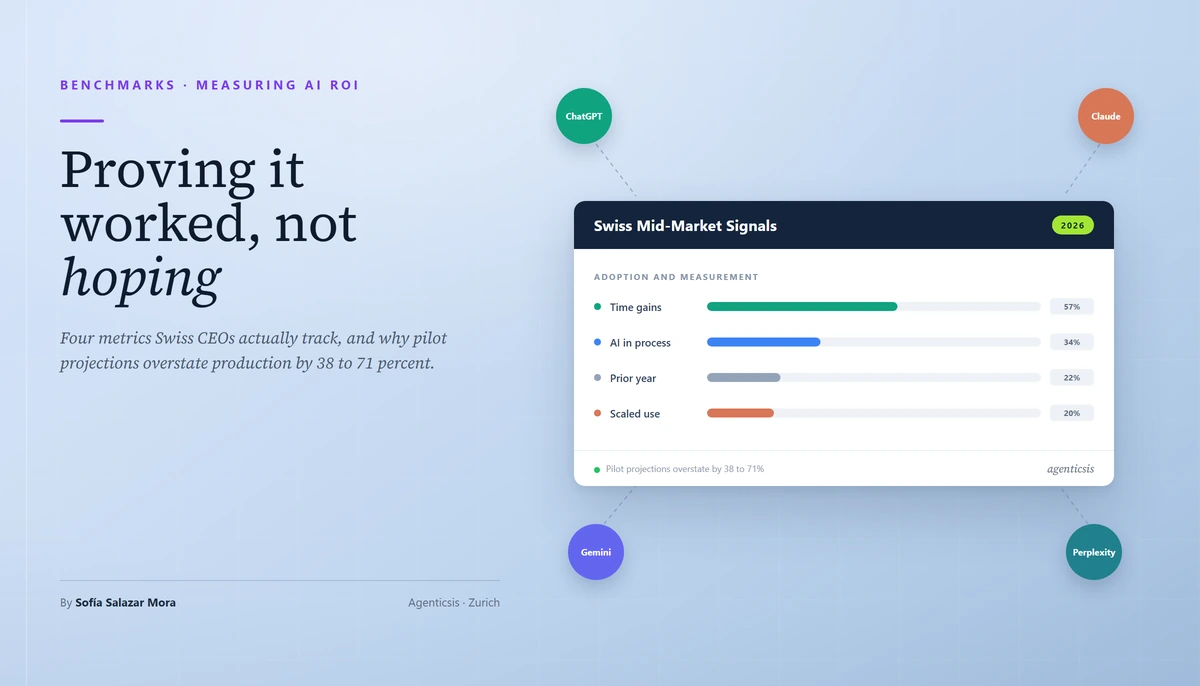
Swiss mid-market companies in 2026 measure AI automation ROI primarily through four hard metrics: time saved per employee, cost per completed task or booked meeting, cycle-time reduction, and payback period. AXA's SME Labour Market Study 2025 shows 34% of Swiss SMEs now deliberately integrate AI into work processes (up from 22%), with 57% of adopters reporting measurable time gains. The strongest CFO-grade benchmark is payback: mid-market SaaS deployments are landing at an average 5.8-month break-even, according to MonteKristo's 2025 production cohort.
Table of Contents
- The State of Swiss Mid-Market AI Adoption in 2026
- The Four Metrics Swiss CEOs Actually Track
- Payback Period Benchmarks by Function
- Time Savings: The Default Starting Metric
- Cost Per Task and Cost Per Meeting Models
- The Five-Input ROI Model for CFO Approval
- Why Pilot ROI Overstates Production Reality
- Function-by-Function ROI Benchmarks
- DACH Regional Comparison: Where Switzerland Leads
- The Five ROI Measurement Mistakes to Avoid
- The 90-Day ROI Validation Blueprint
- Frequently Asked Questions
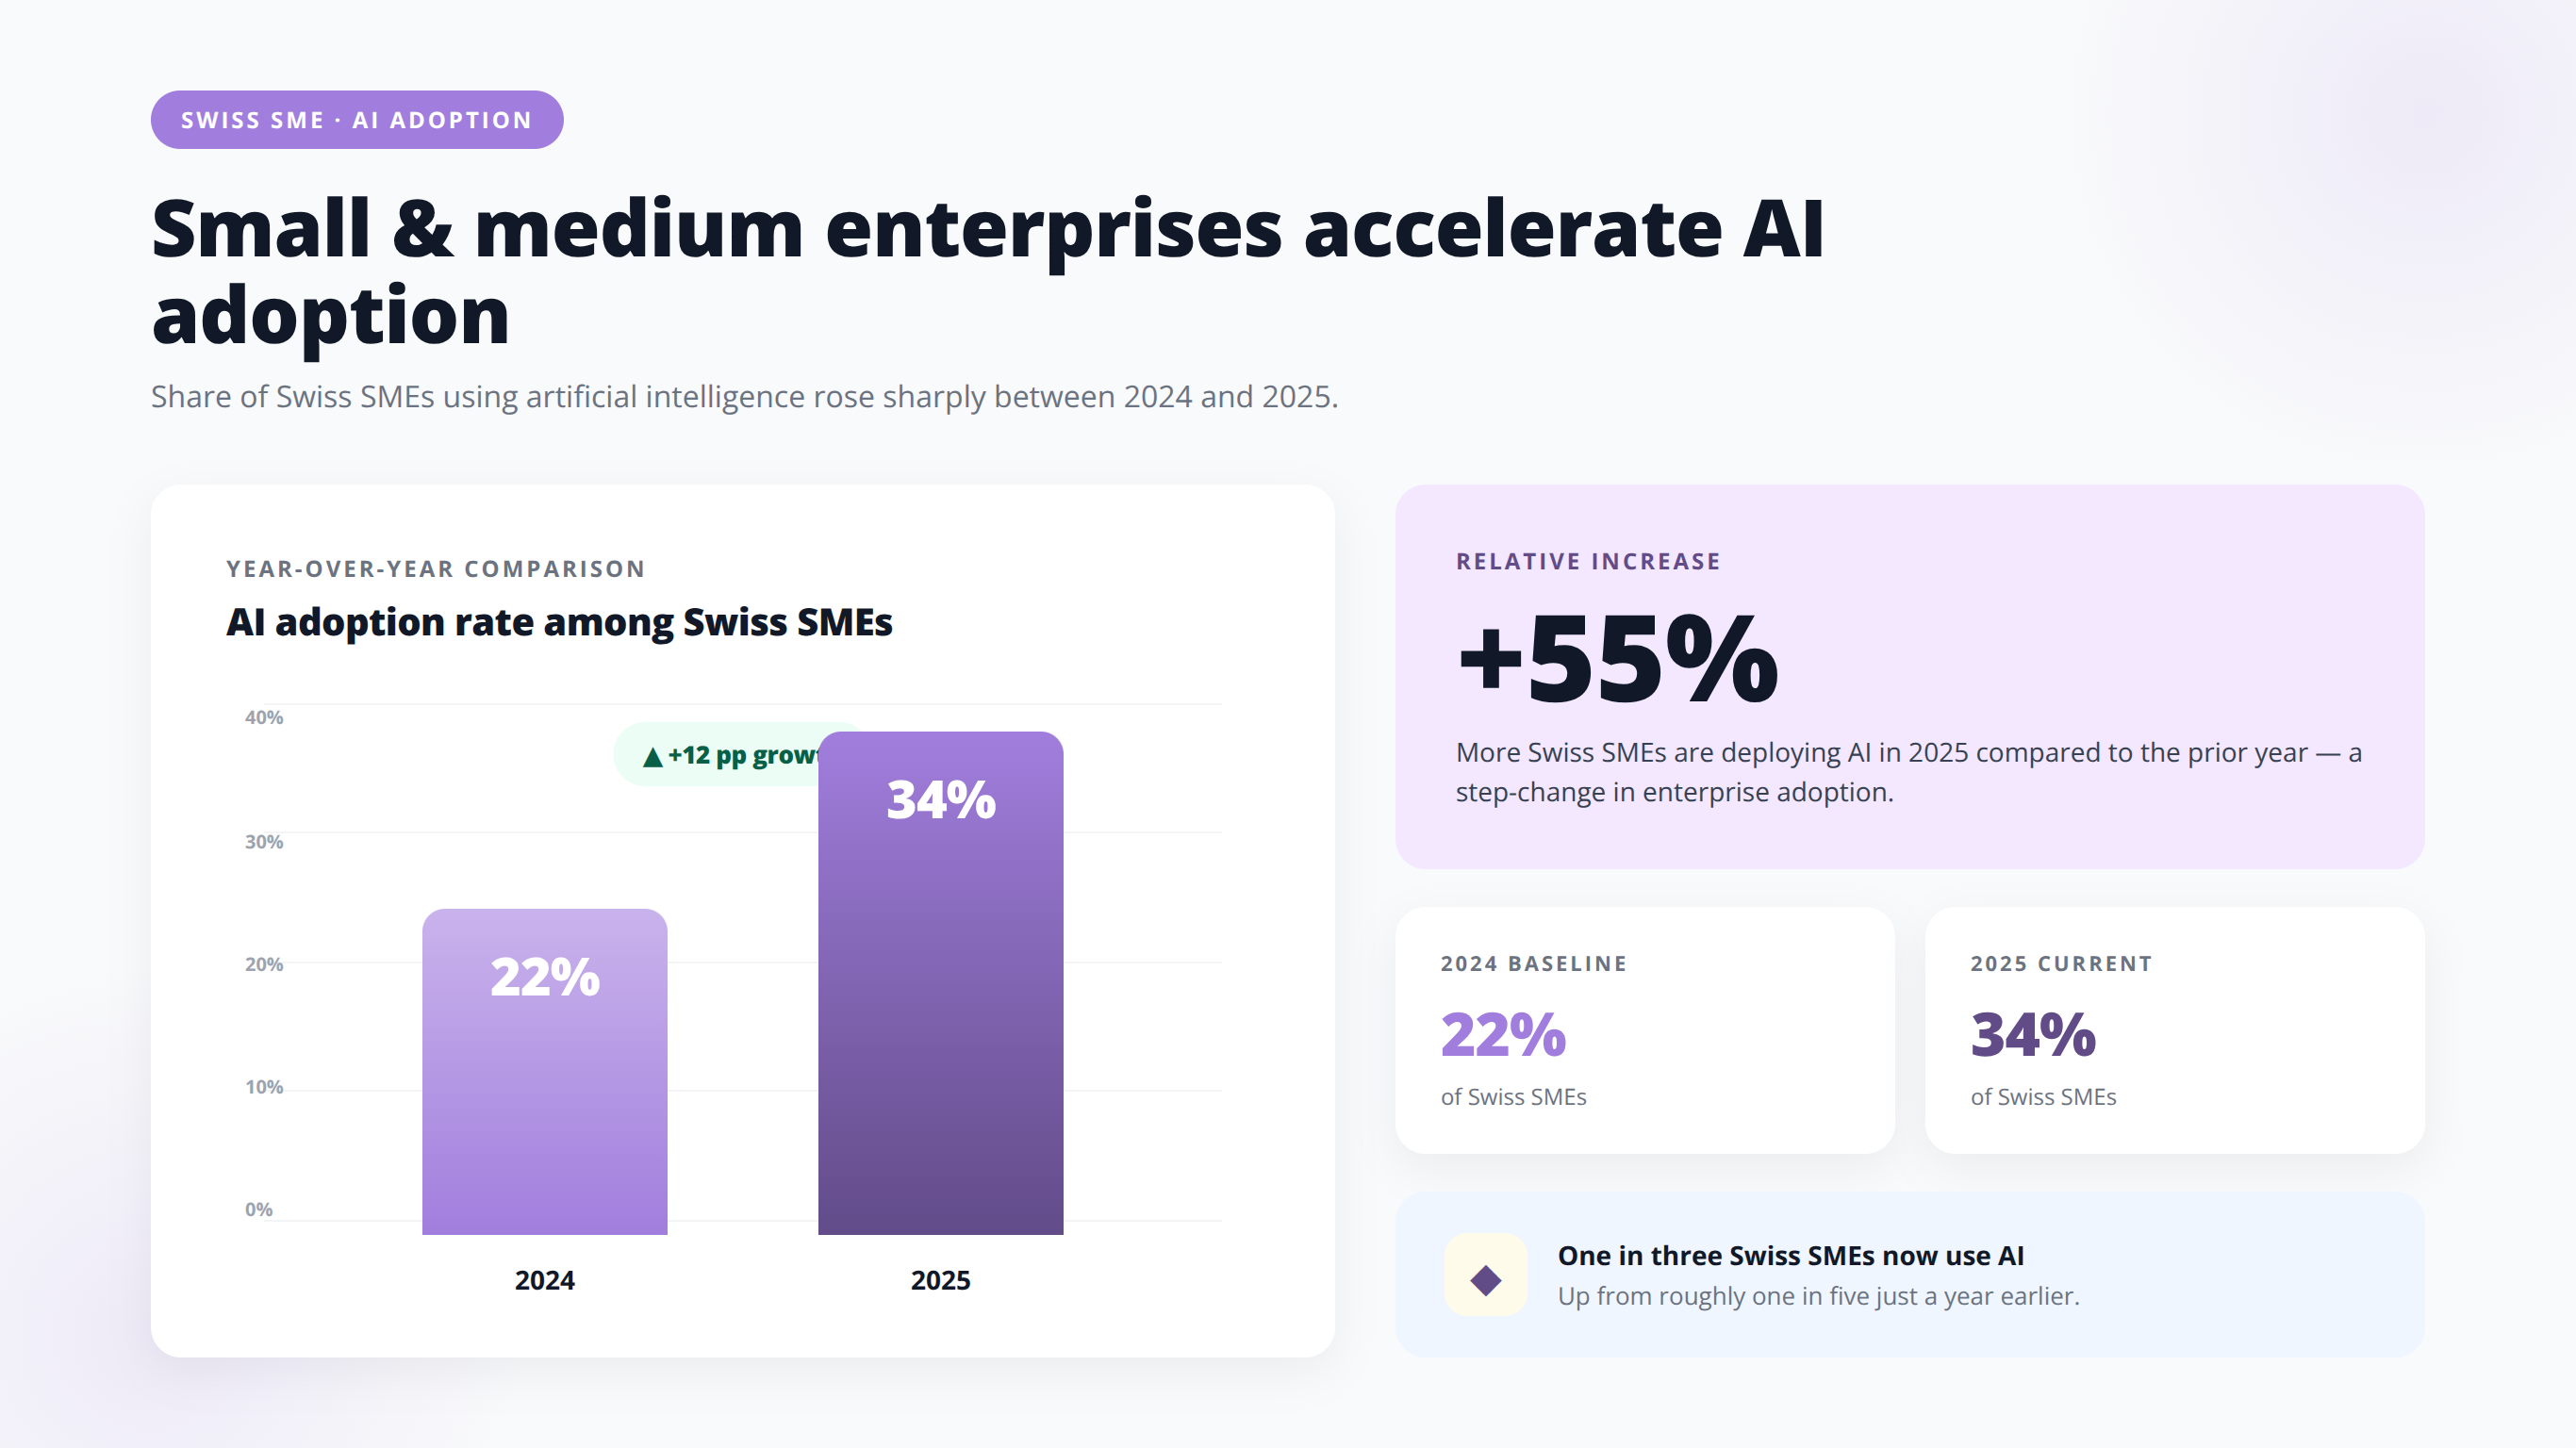
Swiss mid-market CEOs face a specific problem in 2026: the AI adoption curve has flipped from "should we?" to "how do we prove it worked?" AXA's SME Labour Market Study 2025 puts deliberate AI integration in Swiss SMEs at 34%, a jump from 22% the previous year [Source: https://www.advanzo.ch/en-ch/blog/ai-in-sales-2026-numbers-smes]. That means most peers are already deployed. The question boards are now asking is whether the money spent produces returns that hold up under CFO scrutiny.
This article covers what Swiss mid-market companies actually measure, the payback benchmarks holding up in production, and the ROI models that survive contact with real data. We draw on 2026 deployment data from Advanzo, MonteKristo, Deloitte, Wavect, and Forbes Tech Council to give you the numbers, formulas, and functional benchmarks you need to evaluate your own AI programs.
You will learn the four metrics that appear across every credible Swiss ROI framework, the five-input model that gets CFO sign-off, why pilot projections typically overstate returns by 38% to 71%, and how payback periods differ across sales, operations, finance, and security use cases. By the end, you will have a defensible measurement framework for the Swiss mid-market AI automation ROI conversation.
⚠️ Methodology Note
All benchmarks in this article are sourced from named 2025-2026 reports (AXA, Deloitte, MonteKristo, Wavect, Forbes Tech Council, StationX, HubSpot). Cross-country figures come from methodologically distinct studies and should not be arithmetically averaged. Illustrative scenarios are labeled explicitly and do not reflect specific client engagements.
Free Download: Benchmark Your AI ROI Against 2026 Swiss Mid-Market Standards
Download NowThe State of Swiss Mid-Market AI Adoption in 2026
Swiss mid-market AI has crossed the threshold from experimental to routine. The AXA study cited by Advanzo shows deliberate integration at 34% of Swiss SMEs in 2025, up from 22% the year before, a growth rate that mirrors accelerating enterprise adoption across DACH [Source: https://www.advanzo.ch/en-ch/blog/ai-in-sales-2026-numbers-smes].
What "Deliberate Integration" Actually Means
The AXA framing matters. "Deliberate integration" excludes casual ChatGPT use by individual employees. It counts companies that have consciously embedded AI into a workflow, with process changes, tool selection, and typically some form of measurement. This distinction separates real deployments from shadow AI usage that produces no organizational ROI.
Where the 34% Are Deploying First
Wavect's 2026 DACH benchmark identifies the dominant early use cases as text generation, marketing, administration, data analysis, and process automation [Source: https://wavect.io/blog/dach-ai-adoption-benchmark-2026/]. These are high-volume, low-risk workflows where output quality is easy to inspect and time savings are directly measurable. Swiss firms tend to start where the ROI is visible within the first quarter of deployment.
The Adoption-to-Value Gap
Adoption does not equal value capture. Deloitte's 2026 AI in Manufacturing survey reports that 84% of manufacturers already generate measurable value from AI, but only 20% of use cases are deployed at scale [Source: https://www.deloitte.com/ch/fr/Industries/industrial-construction/perspectives/ai-in-manufacturing.html]. The gap between "works in one line" and "scaled across the enterprise" is where most ROI leaks out. Swiss mid-market boards asking "why aren't we seeing the numbers?" are usually looking at a scaling problem, not a technology problem.
💡 Expert Insight
The 84% / 20% gap in Deloitte's manufacturing data is the single most important number for a mid-market CEO to internalize. It tells you that proving one use case works is the easy part. The difficult part — data infrastructure, multisite rollout, legacy integration, and change management — is where four out of five AI programs get stuck. Budget accordingly.
The Four Metrics Swiss CEOs Actually Track
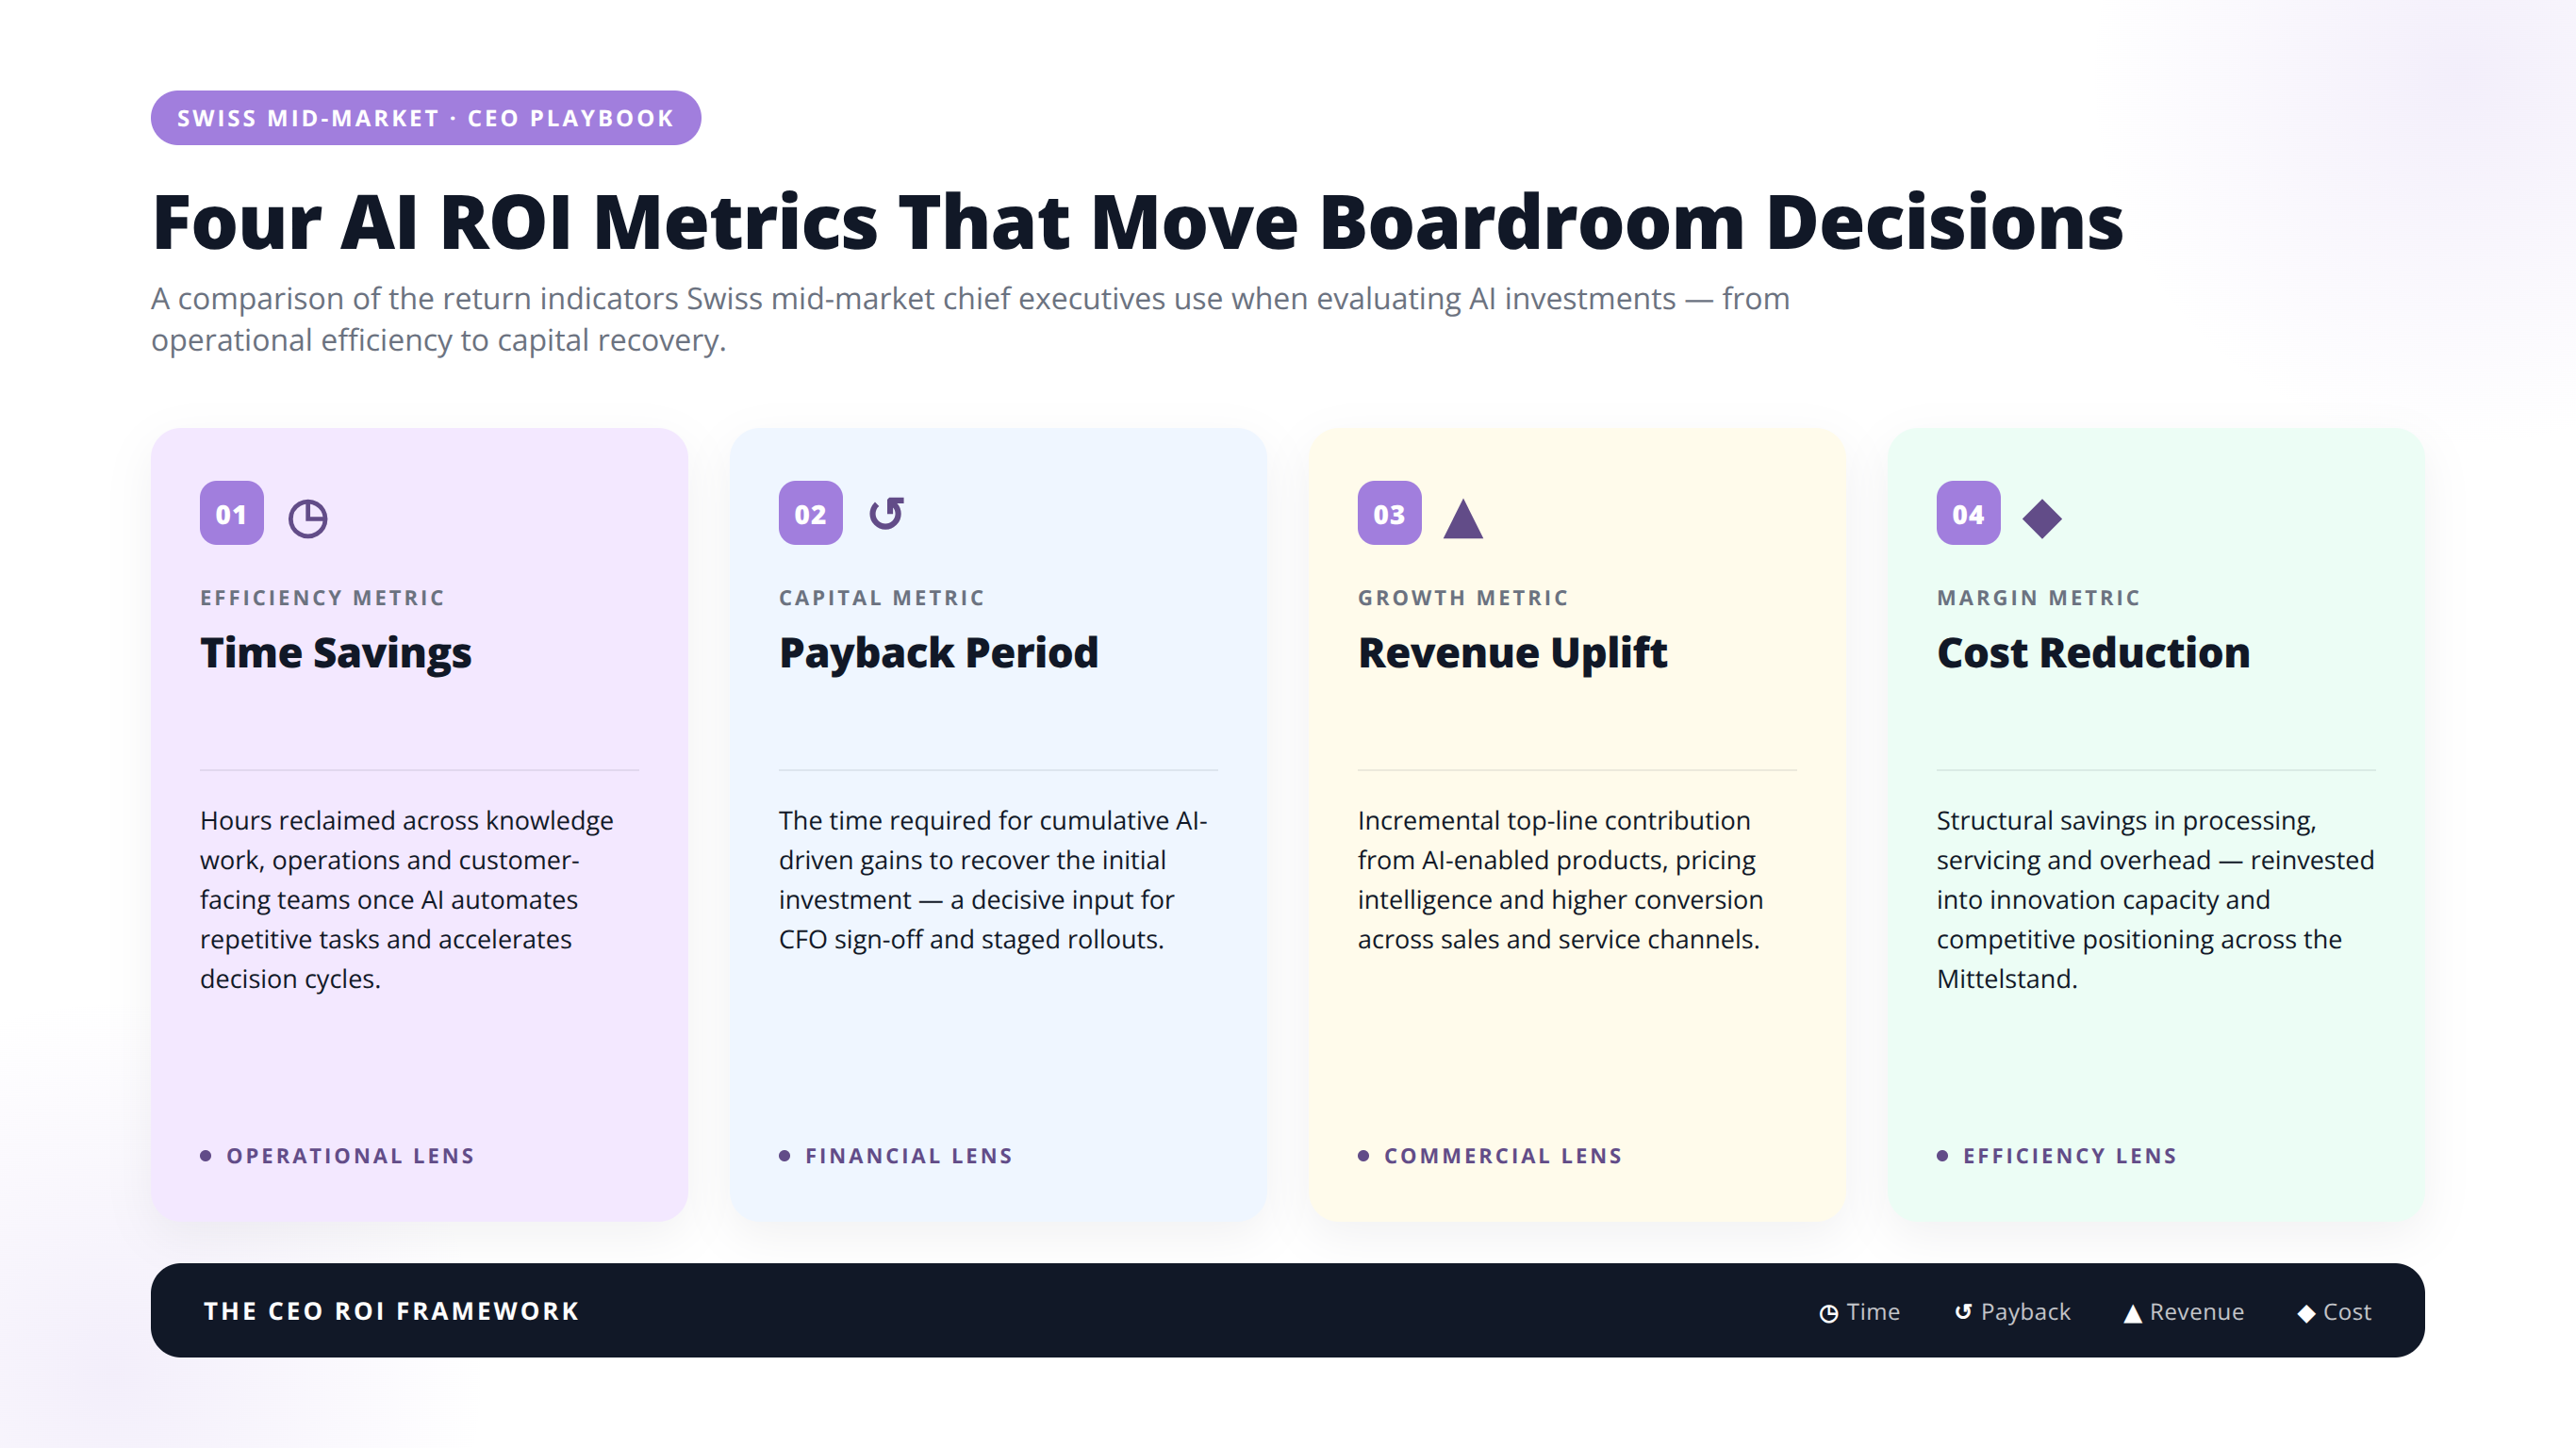
Across the 2026 Swiss and DACH sources, four metrics recur consistently in mid-market AI ROI reporting. Unlike the vague "AI value" claims common in 2023 and 2024, these are finance-grade measures with defensible baselines.
Quick Answer: The Four Core Metrics
Swiss mid-market CEOs in 2026 track (1) time saved per employee per week, (2) cost per task or booked meeting, (3) cycle-time reduction in days or hours, and (4) payback period in months. Payback is the CFO's gate metric, with 5-9 months being the acceptable window for board approval.
1. Time Saved Per Employee Per Week
This is the entry-level metric because it is the easiest to baseline. HubSpot's 2025 seller benchmark, cited by Advanzo, shows 64% of sellers save 1 to 5 hours per week when using AI-enabled tools [Source: https://www.advanzo.ch/en-ch/blog/ai-in-sales-2026-numbers-smes]. Multiplied across a 30-person sales team at Swiss loaded labor rates (typically CHF 90 to 140 per hour), even the low end produces material savings.
2. Cost Per Task or Cost Per Booked Meeting
MonteKristo's 2026 sales automation benchmark documents 18% to 34% lower SDR cost per qualified meeting when AI is layered into the outbound stack [Source: https://www.montekristo.co/blog/ai-sales-automation-roi-2026]. This metric works because it isolates the AI contribution: baseline cost divided by output, before and after deployment.
3. Cycle-Time Reduction
For operational workflows, cycle time is the honest number. How many days did quote-to-cash take before AI, and how many days does it take now? Deloitte's 2026 manufacturing data highlights cycle-time improvements as one of the most consistently measurable KPI lifts [Source: https://www.deloitte.com/ch/fr/Industries/industrial-construction/perspectives/ai-in-manufacturing.html].
4. Payback Period
The CFO's favorite metric. MonteKristo reports mid-market SaaS deployments landing in a 5- to 9-month payback window, with 5.8 months as the 2025 production cohort average [Source: https://www.montekristo.co/blog/ai-sales-automation-roi-2026]. Anything beyond 12 months typically fails Swiss mid-market board scrutiny in 2026.
| Metric | What It Measures | Best Use Case | Difficulty to Baseline |
|---|---|---|---|
| Time saved per week | Hours reclaimed per employee | Sales, admin, marketing | Low |
| Cost per task/meeting | Unit economics of output | Sales, service, ops | Medium |
| Cycle-time reduction | Days or hours per process | Manufacturing, finance, logistics | Medium |
| Payback period | Months to break even | All functions, CFO reporting | High |
Payback Period Benchmarks by Function
Payback is the metric that gets AI investments approved or killed. The 2026 data reveals meaningful variation by function, and the differences matter for how CEOs sequence deployments.
Quick Answer: Payback by Function
Sales automation pays back fastest (5-9 months, 5.8-month average), followed by customer service (6-10 months), finance back-office (8-12 months), and manufacturing operations (9-18 months). Security operations pay back immediately upon a single avoided breach ($2.22M per incident, per StationX 2026).
Sales Automation: 5 to 9 Months
MonteKristo's 2025 production cohort shows an average payback of 5.8 months across mid-market SaaS sales deployments, with voice-first patterns hitting break-even at 4.9 months [Source: https://www.montekristo.co/blog/ai-sales-automation-roi-2026]. Sales pays back fastest because the revenue lift is measurable in the same quarter as deployment.
Customer Service: 6 to 10 Months
Service deployments typically take slightly longer because the savings are cost-side (deflected tickets, reduced handle time) and Swiss mid-market service teams are often smaller than their sales counterparts. The payback math is real but takes a quarter longer to compound.
Operations and Manufacturing: 9 to 18 Months
Deloitte's 2026 manufacturing findings imply longer payback windows because operational deployments require data infrastructure, integration with legacy systems, and multisite rollout to reach scale [Source: https://www.deloitte.com/ch/fr/Industries/industrial-construction/perspectives/ai-in-manufacturing.html]. The 20% scaling rate reflects this friction.
Security Operations: Immediate on Breach Avoidance
StationX's 2026 cybersecurity spending analysis reports that AI and automation in security operations save $2.22M per breach [Source: https://app.stationx.net/articles/cybersecurity-spending-statistics]. Payback math here works differently: a single avoided incident can justify years of platform cost.
💡 Expert Insight
Sequencing matters. If your board has limited tolerance for AI investments that take longer than 12 months to prove themselves, start with sales automation — not because it is intrinsically more valuable, but because it produces the earliest, most defensible payback evidence. Use that credibility to fund the operational and manufacturing use cases that need longer windows.
Free Download: Download Our Swiss Mid-Market AI ROI Benchmark Sheet
Download NowTime Savings: The Default Starting Metric
Time savings is where most Swiss mid-market ROI conversations begin, and for good reason: the baseline is easy to establish, the delta is easy to measure, and the translation to Swiss franc value is a simple multiplication.
The 57% Signal
Among Swiss SMEs using AI, 57% report measurable time gains [Source: https://www.advanzo.ch/en-ch/blog/ai-in-sales-2026-numbers-smes]. That is a majority, but it also means 43% of deployments produce no measurable time savings, usually because the workflow was not high-volume enough or the AI output required extensive human review.
How to Baseline Correctly
The mistake most CEOs make is asking employees to estimate their own time savings after deployment. The estimates are almost always inflated. The correct approach is to timestamp the target workflow for two weeks before deployment, then timestamp it again for two weeks after stabilization. The delta is your real number.
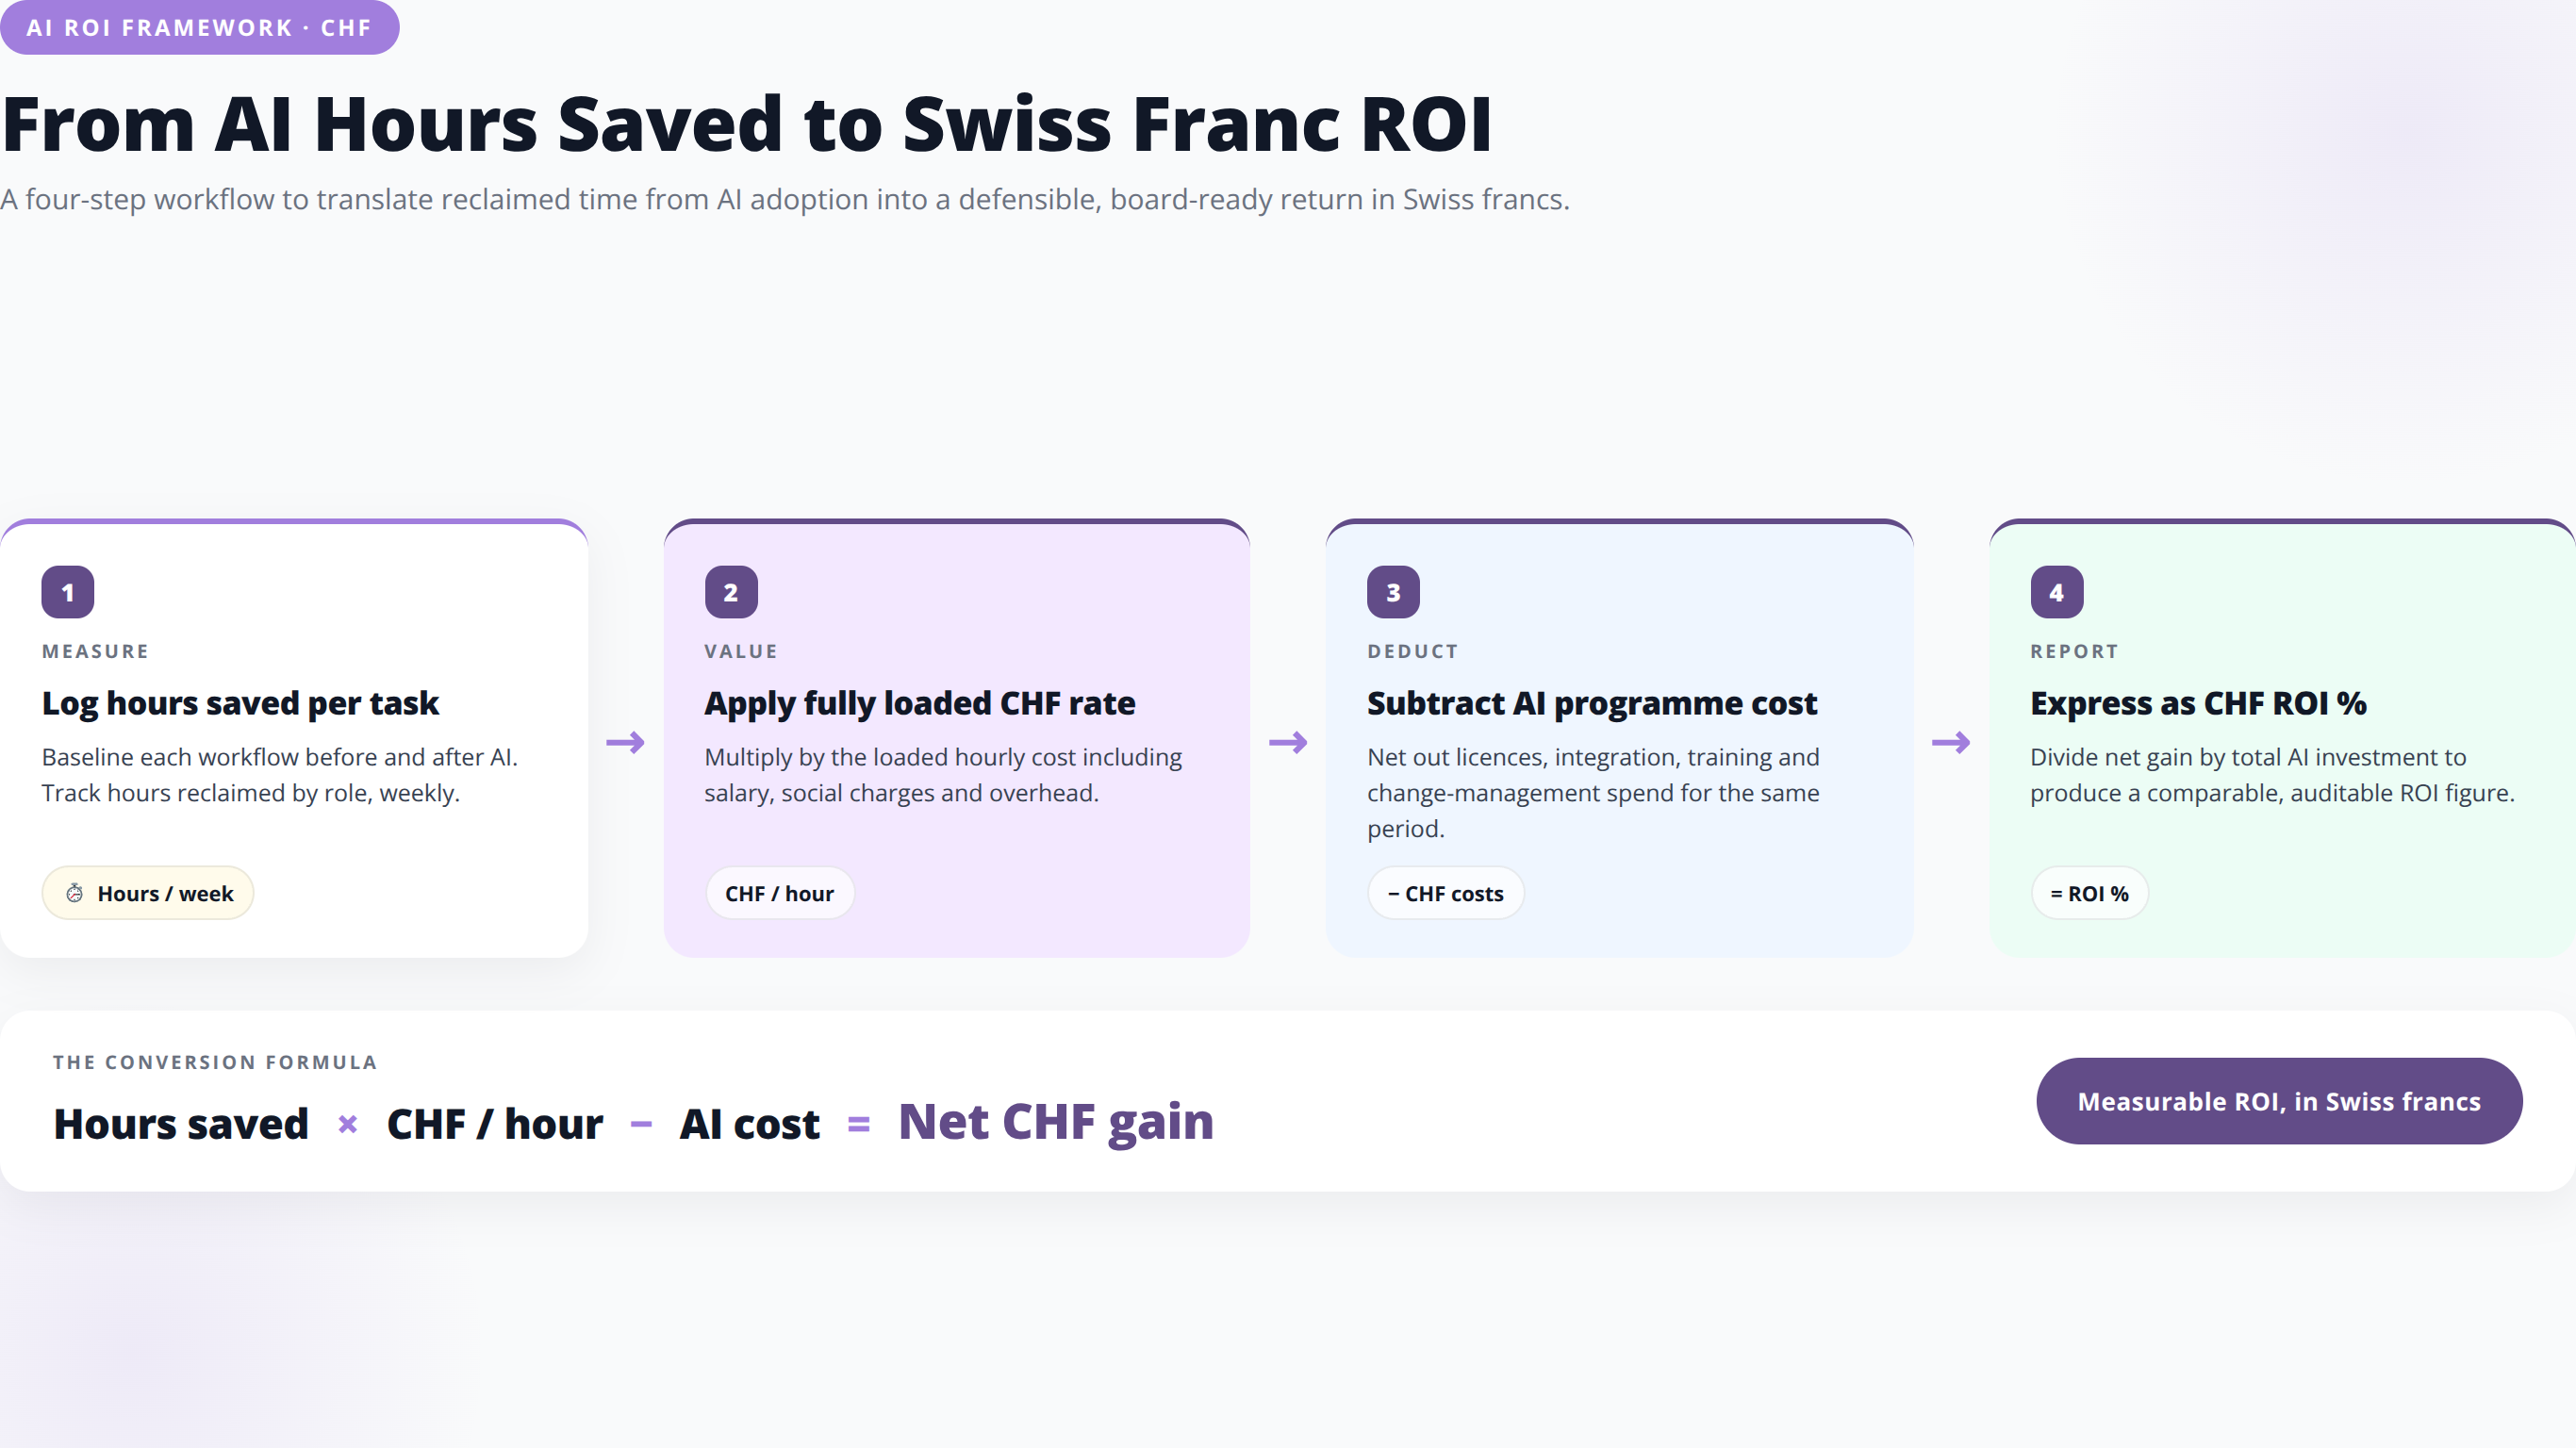
Converting Hours to Francs
A Swiss mid-market fully loaded labor cost typically ranges from CHF 90 to CHF 140 per hour depending on function and seniority. If AI saves a 30-person team 3 hours per week per employee, that is 4,680 hours annually, translating to CHF 421,000 to CHF 655,000 in reclaimed capacity. Whether that capacity converts to actual bottom-line savings or is absorbed into more work is the second question, and it is the one CFOs ask next.
The Capacity Absorption Problem
Reclaimed hours only become ROI if the organization either reduces headcount, avoids new hires, or redeploys the capacity to higher-value revenue-generating work. Swiss mid-market culture typically resists the first, so the ROI case usually hinges on avoided hiring or revenue reallocation. Both need to be quantified explicitly in the business case.
💡 Pro Tip
Before writing "CHF X saved" in your business case, write one sentence naming exactly which role will not be backfilled, which revenue activity the freed hours will fund, or which overtime line item will drop. If you cannot write that sentence, the ROI number is theoretical, not real.
Cost Per Task and Cost Per Meeting Models
Cost per task is the metric that best isolates AI's contribution from other business changes. It works by defining a specific output (booked meeting, processed invoice, resolved ticket) and comparing the fully loaded cost of producing it before and after AI.
The Sales Benchmark: 18% to 34% Lower
MonteKristo's 2026 data shows Swiss and DACH mid-market SDR teams achieving 18% to 34% lower cost per qualified meeting with AI-augmented outbound stacks [Source: https://www.montekristo.co/blog/ai-sales-automation-roi-2026]. The range is wide because it depends heavily on baseline data quality and how much of the SDR workflow is genuinely automatable.
How to Structure the Calculation
Cost per task requires three numbers: total function cost (labor plus tools plus overhead), total output volume, and the timeframe. Divide cost by output to get the unit economic. Track it monthly. When the AI is switched on, the ratio should improve within 60 to 90 days if the deployment is well-designed.
Why This Metric Beats "Productivity Percentage"
Vendors love to quote productivity percentages ("40% more productive"). CFOs distrust them because the baseline is rarely defined. Cost per task ties directly to the P&L: if you produce the same output for less money, or more output for the same money, the improvement appears in the numbers without argument.
Application Beyond Sales
The same framework applies to cost per processed invoice in finance, cost per resolved ticket in service, cost per generated report in analytics, and cost per closed compliance check in risk. Any high-volume repetitive task with a definable output unit can be measured this way.
The Five-Input ROI Model for CFO Approval
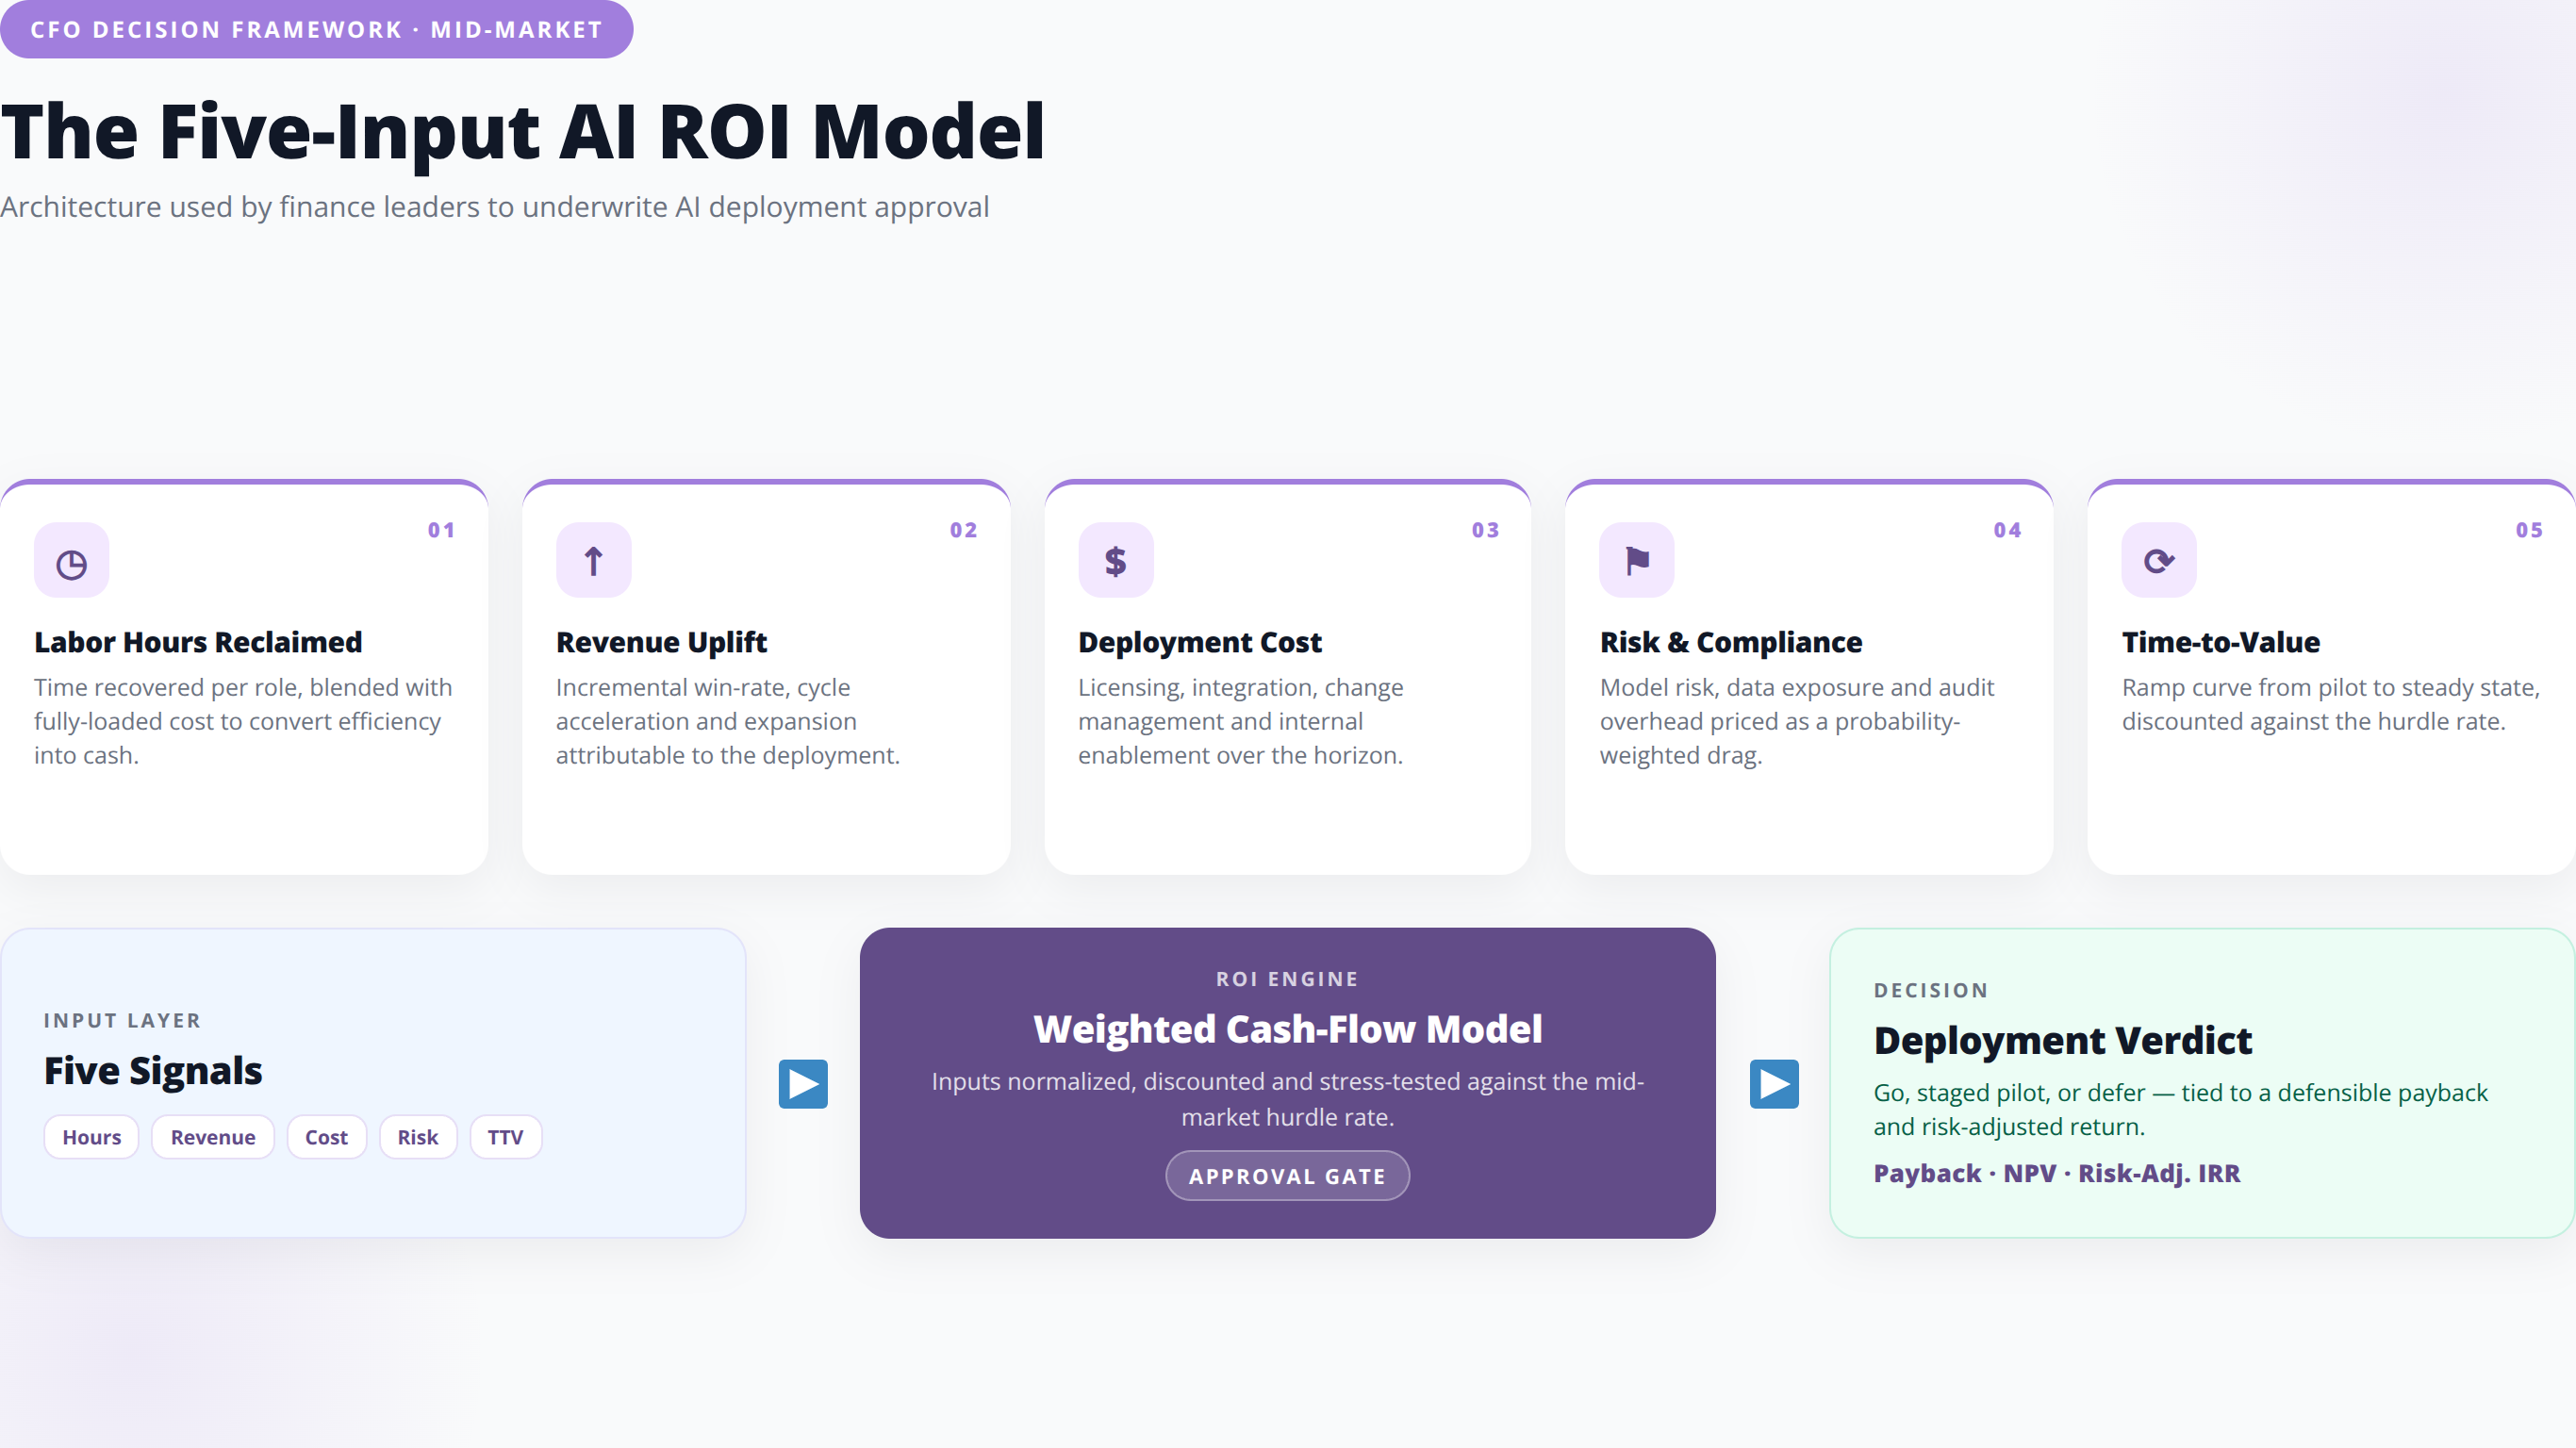
MonteKristo's 2026 framework strips AI ROI down to five inputs that a CFO can audit [Source: https://www.montekristo.co/blog/ai-sales-automation-roi-2026]. This model has become the default among mid-market Swiss deployments because it eliminates the "AI magic" arguments that inflate business cases.
Quick Answer: The Five Inputs
(1) Meeting or task volume baseline, (2) cost per meeting/task baseline, (3) AI infrastructure capex, (4) AI infrastructure opex, (5) net delta on close/resolution rate. Every additional variable reduces auditability, so mid-market CFOs prefer this minimal specification.
The Five Inputs
- Meeting volume baseline (or task volume, ticket volume, invoice volume): the current output rate
- Cost per booked meeting baseline: the current unit economic
- AI infrastructure capex: one-time setup, integration, and training costs
- AI infrastructure opex: monthly platform, API, and maintenance costs
- Net delta on close rate (or resolution rate, throughput rate): the expected quality improvement
Why These Five and Not Ten
Every additional input reduces the model's auditability. The five-input version can be validated by a finance team in under an hour. It also forces the AI vendor or internal team to commit to specific numbers, which is where inflated projections get exposed.
Running the Sensitivity Analysis
Before approval, the model should be stress-tested by moving each input up and down 25%. If the ROI case only works when close-rate delta is at the top of the range and infrastructure opex is at the bottom, the deployment is fragile. Robust cases hold up when three of the five inputs move against you.
| Input | Data Source | Auditability | Common Manipulation Risk |
|---|---|---|---|
| Meeting volume baseline | CRM / operations system | High | Low |
| Cost per meeting baseline | Finance system + payroll | High | Low |
| AI infrastructure capex | Vendor SOW | Medium | Medium (scope creep) |
| AI infrastructure opex | Vendor pricing sheet | Medium | High (usage variance) |
| Net delta on close rate | Pilot data or benchmark | Low | Very High |
💡 Expert Insight
Input #5 — net delta on close rate — is where 80% of business-case disputes occur. It is the least auditable and the most manipulable. Insist that this number come from either a 90-day production pilot with real data, or from a published benchmark with a named source and methodology. "Vendor estimate" is not an acceptable data source for the input that swings the model most.
Why Pilot ROI Overstates Production Reality
One of the most useful findings in the 2026 data is MonteKristo's observation that pre-deployment ROI models often overstate returns by 38% to 71% versus eventual production outcomes [Source: https://www.montekristo.co/blog/ai-sales-automation-roi-2026]. Understanding why this happens is critical for Swiss CEOs sizing investments.
Quick Answer: Why Pilots Overstate
Pilot ROI overstates production reality by 38-71% for four reasons: (1) pilots use cherry-picked clean data, (2) pilots run on motivated star teams, (3) infrastructure opex in production is 2-4x pilot cost, and (4) adoption drops from 90%+ in pilots to 40-60% in early production.
The Cherry-Picked Pilot Problem
Pilots are almost always run on the best data, the most motivated team, and the cleanest workflow. Production environments have messy data, average teams, and workflows with exceptions. The gap between the two is where the 38% to 71% overstatement lives.
Infrastructure Cost Underestimation
Pilots typically run on developer credits or free tiers. Production costs (compute, API usage, integration maintenance, monitoring) are frequently 2 to 4 times higher than pilot projections. Forbes' July 2026 mid-market commentary specifically warns about setting strict monthly cost caps before deployment to prevent this drift [Source: https://www.forbes.com/councils/forbestechcouncil/2026/07/23/dont-automate-a-broken-factory-the-mid-markets-real-ai-test/].
Adoption Rate Reality
Pilot participants use the tool 90%+ of the time because they signed up. Production adoption in month one is typically 40% to 60%, climbing to 70% to 85% by month six with active change management. The revenue and savings projections assumed 100% adoption; the reality is materially lower.
The 90-Day Pilot Fix
MonteKristo argues for a genuine 90-day pilot with production-representative data rather than a spreadsheet-only planning exercise. The pilot should include the messy edge cases, be staffed by average performers, and run on production-priced infrastructure. The ROI numbers coming out of that pilot survive the transition to full deployment.
Free Download: Schedule an AI ROI Validation Call
Download NowFunction-by-Function ROI Benchmarks
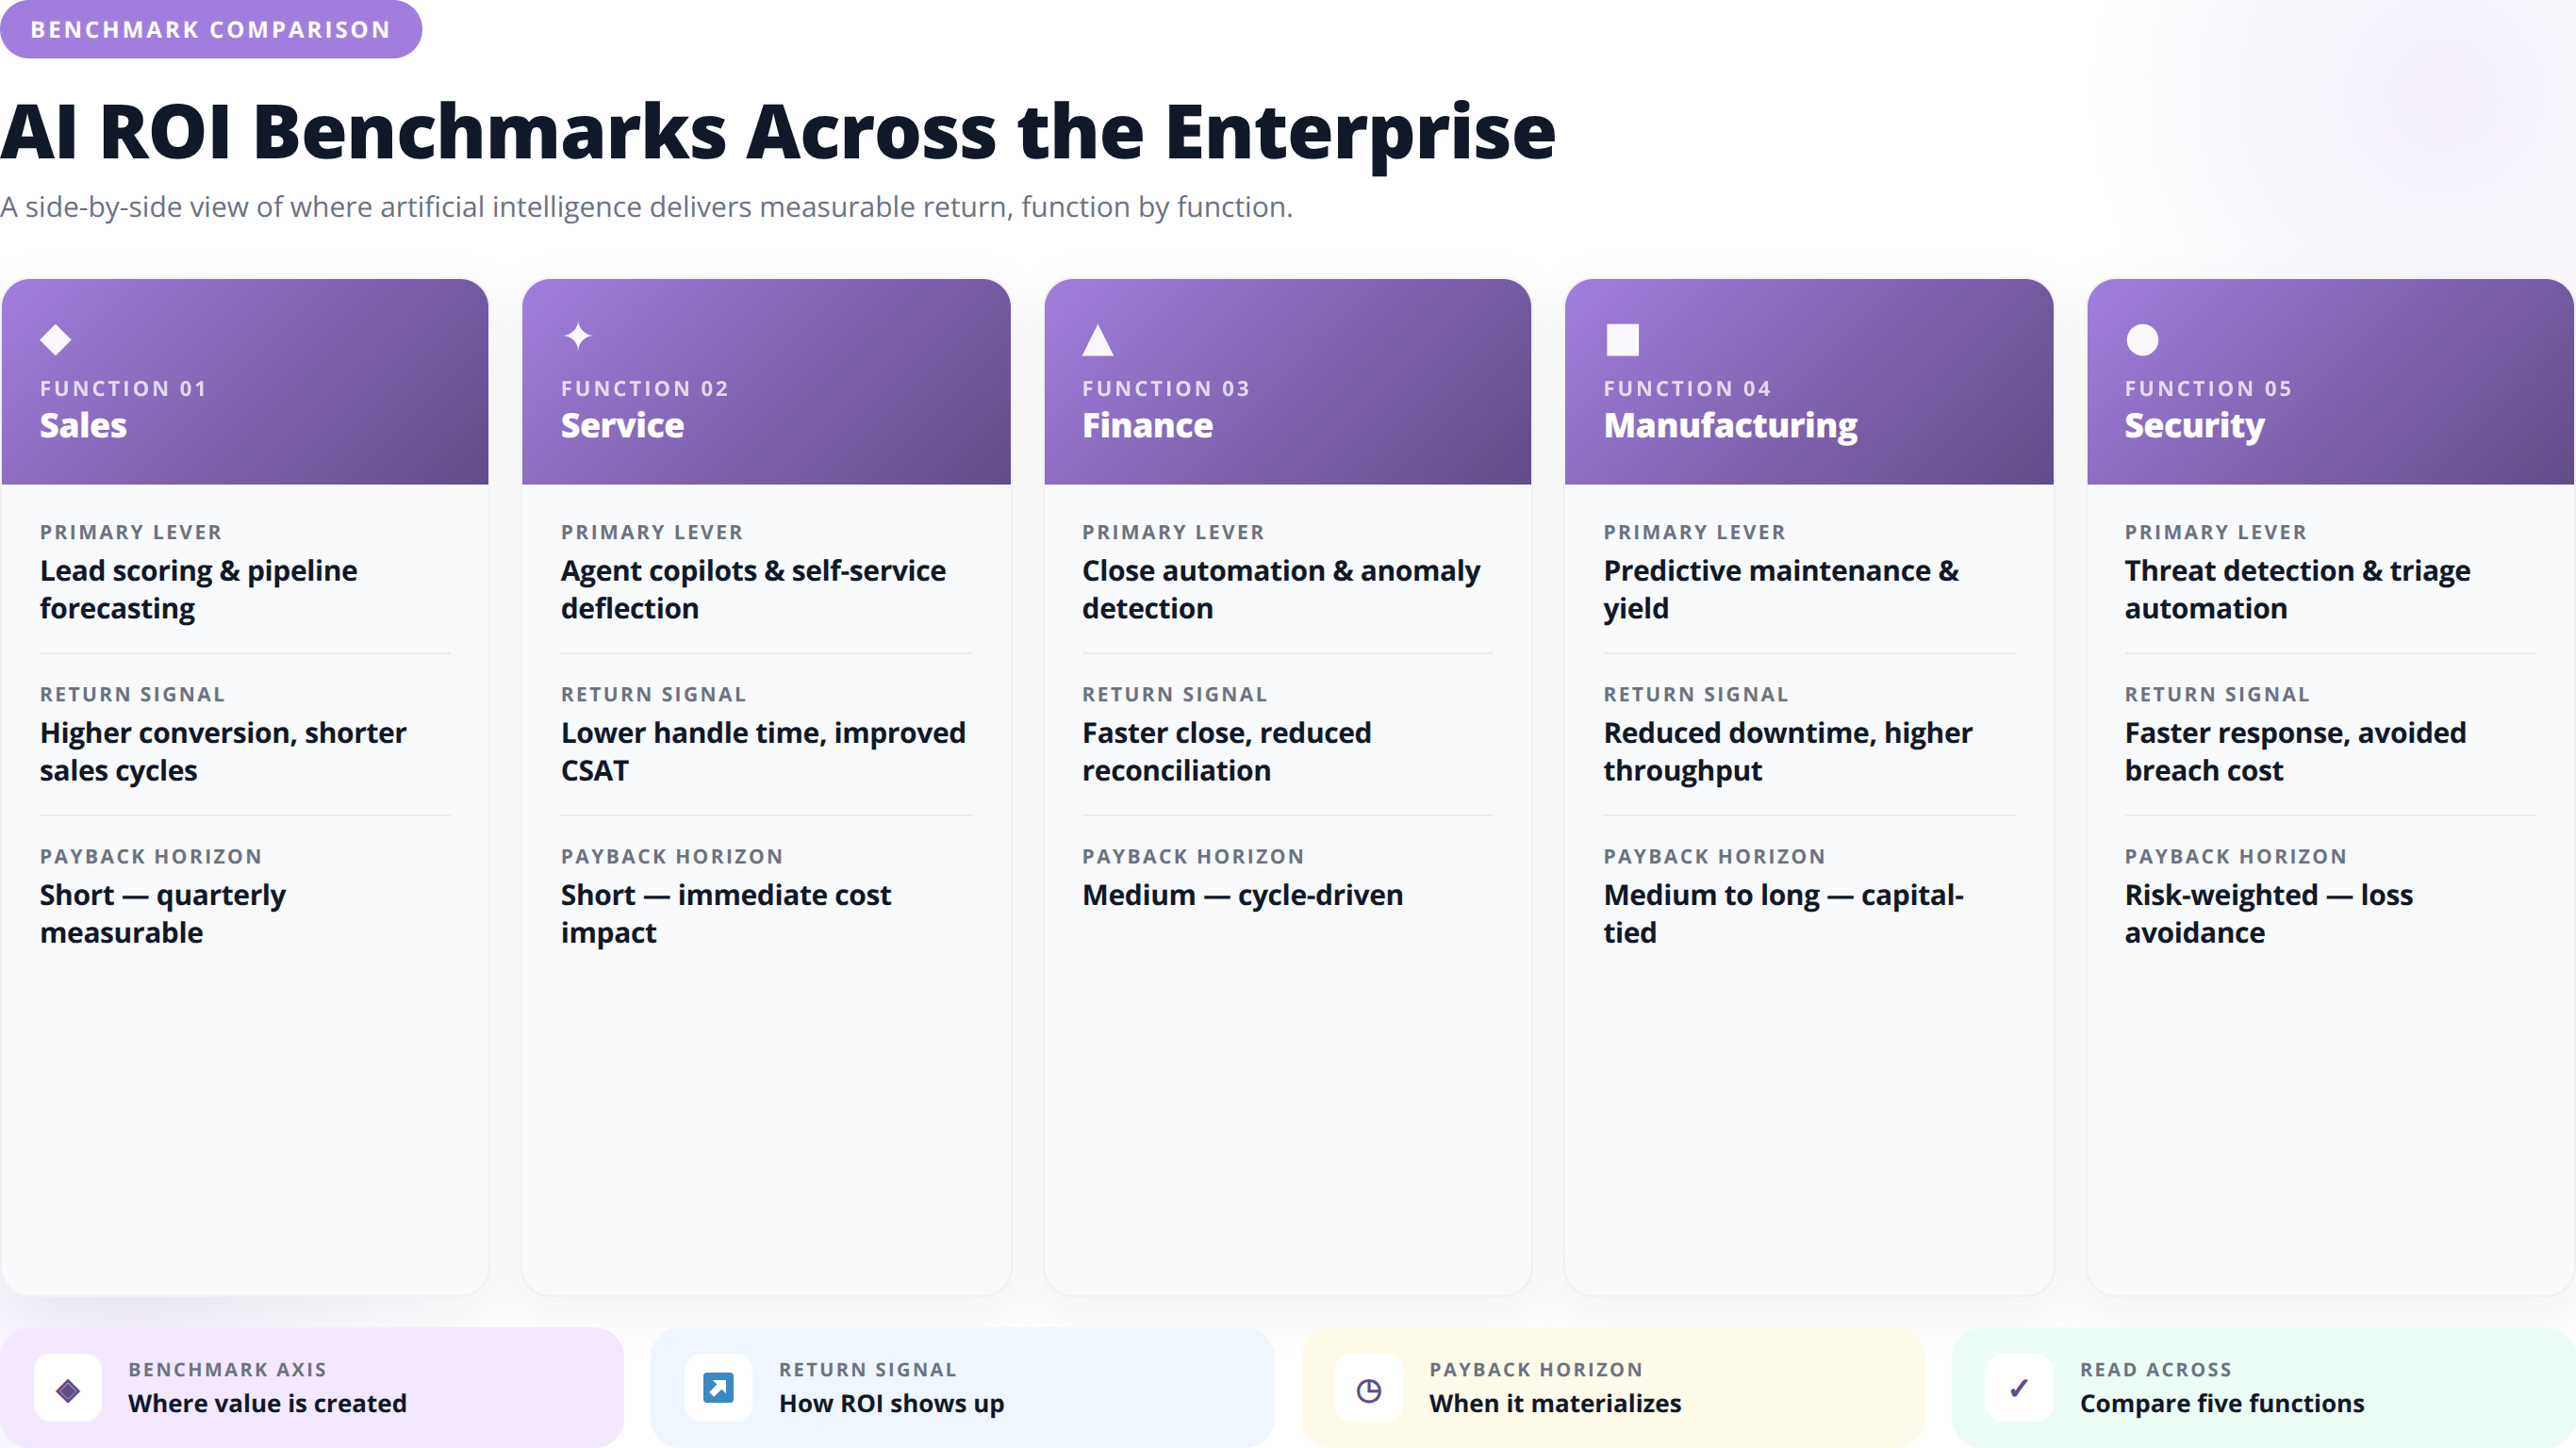
Aggregating "AI ROI" across a company hides more than it reveals. The 2026 benchmarks break down cleanly by function, and CEOs should evaluate each deployment against the appropriate reference class.
Sales and Revenue Operations
Expected metrics: 18% to 34% lower cost per qualified meeting, 5.8-month average payback, 1 to 5 hours weekly time savings per seller [Source: https://www.montekristo.co/blog/ai-sales-automation-roi-2026] [Source: https://www.advanzo.ch/en-ch/blog/ai-in-sales-2026-numbers-smes]. High-confidence deployment area for Swiss mid-market.
Customer Service and Support
Expected metrics: ticket deflection rates of 20% to 40%, handle-time reduction of 15% to 30%, payback typically 6 to 10 months. Watch for CSAT impact; poorly deployed AI service degrades customer experience faster than any other function.
Finance and Back Office
Expected metrics: cycle-time reduction on invoice processing and reconciliation of 40% to 70%, error rate reduction, payback typically 8 to 12 months due to integration complexity with legacy Swiss accounting systems.
Manufacturing and Operations
Deloitte's 84% "measurable value" figure is encouraging, but only 20% at-scale deployment [Source: https://www.deloitte.com/ch/fr/Industries/industrial-construction/perspectives/ai-in-manufacturing.html] means CEOs should expect longer payback windows (9 to 18 months) and factor in multisite rollout costs.
Security Operations
StationX's $2.22M per breach avoidance figure [Source: https://app.stationx.net/articles/cybersecurity-spending-statistics] means security ROI is dominated by tail-risk math rather than efficiency math. Payback is effectively immediate if a breach is prevented, and zero if none was going to occur regardless.
| Function | Primary ROI Metric | Typical Payback | Risk Level |
|---|---|---|---|
| Sales | Cost per meeting, revenue lift | 5-9 months | Low |
| Customer Service | Deflection rate, handle time | 6-10 months | Medium (CSAT risk) |
| Finance / Back Office | Cycle time, error rate | 8-12 months | Medium (integration) |
| Manufacturing / Ops | KPI lift, throughput | 9-18 months | High (scaling) |
| Security | Breach cost avoidance | Immediate on incident | Tail risk |
DACH Regional Comparison: Where Switzerland Leads
Swiss mid-market CEOs benchmarking against regional peers should look at DACH figures with methodological caution. Wavect's 2026 analysis places deliberate SME AI adoption at 34% in Switzerland, 30% in Austria, and 26% in Germany, but warns against averaging the Swiss figure with Eurostat series due to methodology differences [Source: https://wavect.io/blog/dach-ai-adoption-benchmark-2026/].
Why Switzerland Leads
Swiss mid-market advantages compound: higher labor costs make automation ROI clearer, tighter labor markets create acute hiring pressure, and stronger digital infrastructure lowers integration friction. The 34% adoption rate reflects those structural advantages, not superior AI capability.
Where the DACH Neighbors Are Catching Up
German mid-market manufacturing is closing the gap fast in operational AI, particularly in physical AI and machine-learning-driven quality control. Austrian SMEs lead in AI-augmented professional services. Swiss firms should not assume permanent leadership.
The Cross-Border Talent Question
Swiss AI implementation talent frequently comes from across the DACH region and further afield. ROI models should factor in the actual availability and cost of implementation resources, which vary significantly between Zurich, Geneva, and the smaller Swiss cities.
The Five ROI Measurement Mistakes to Avoid
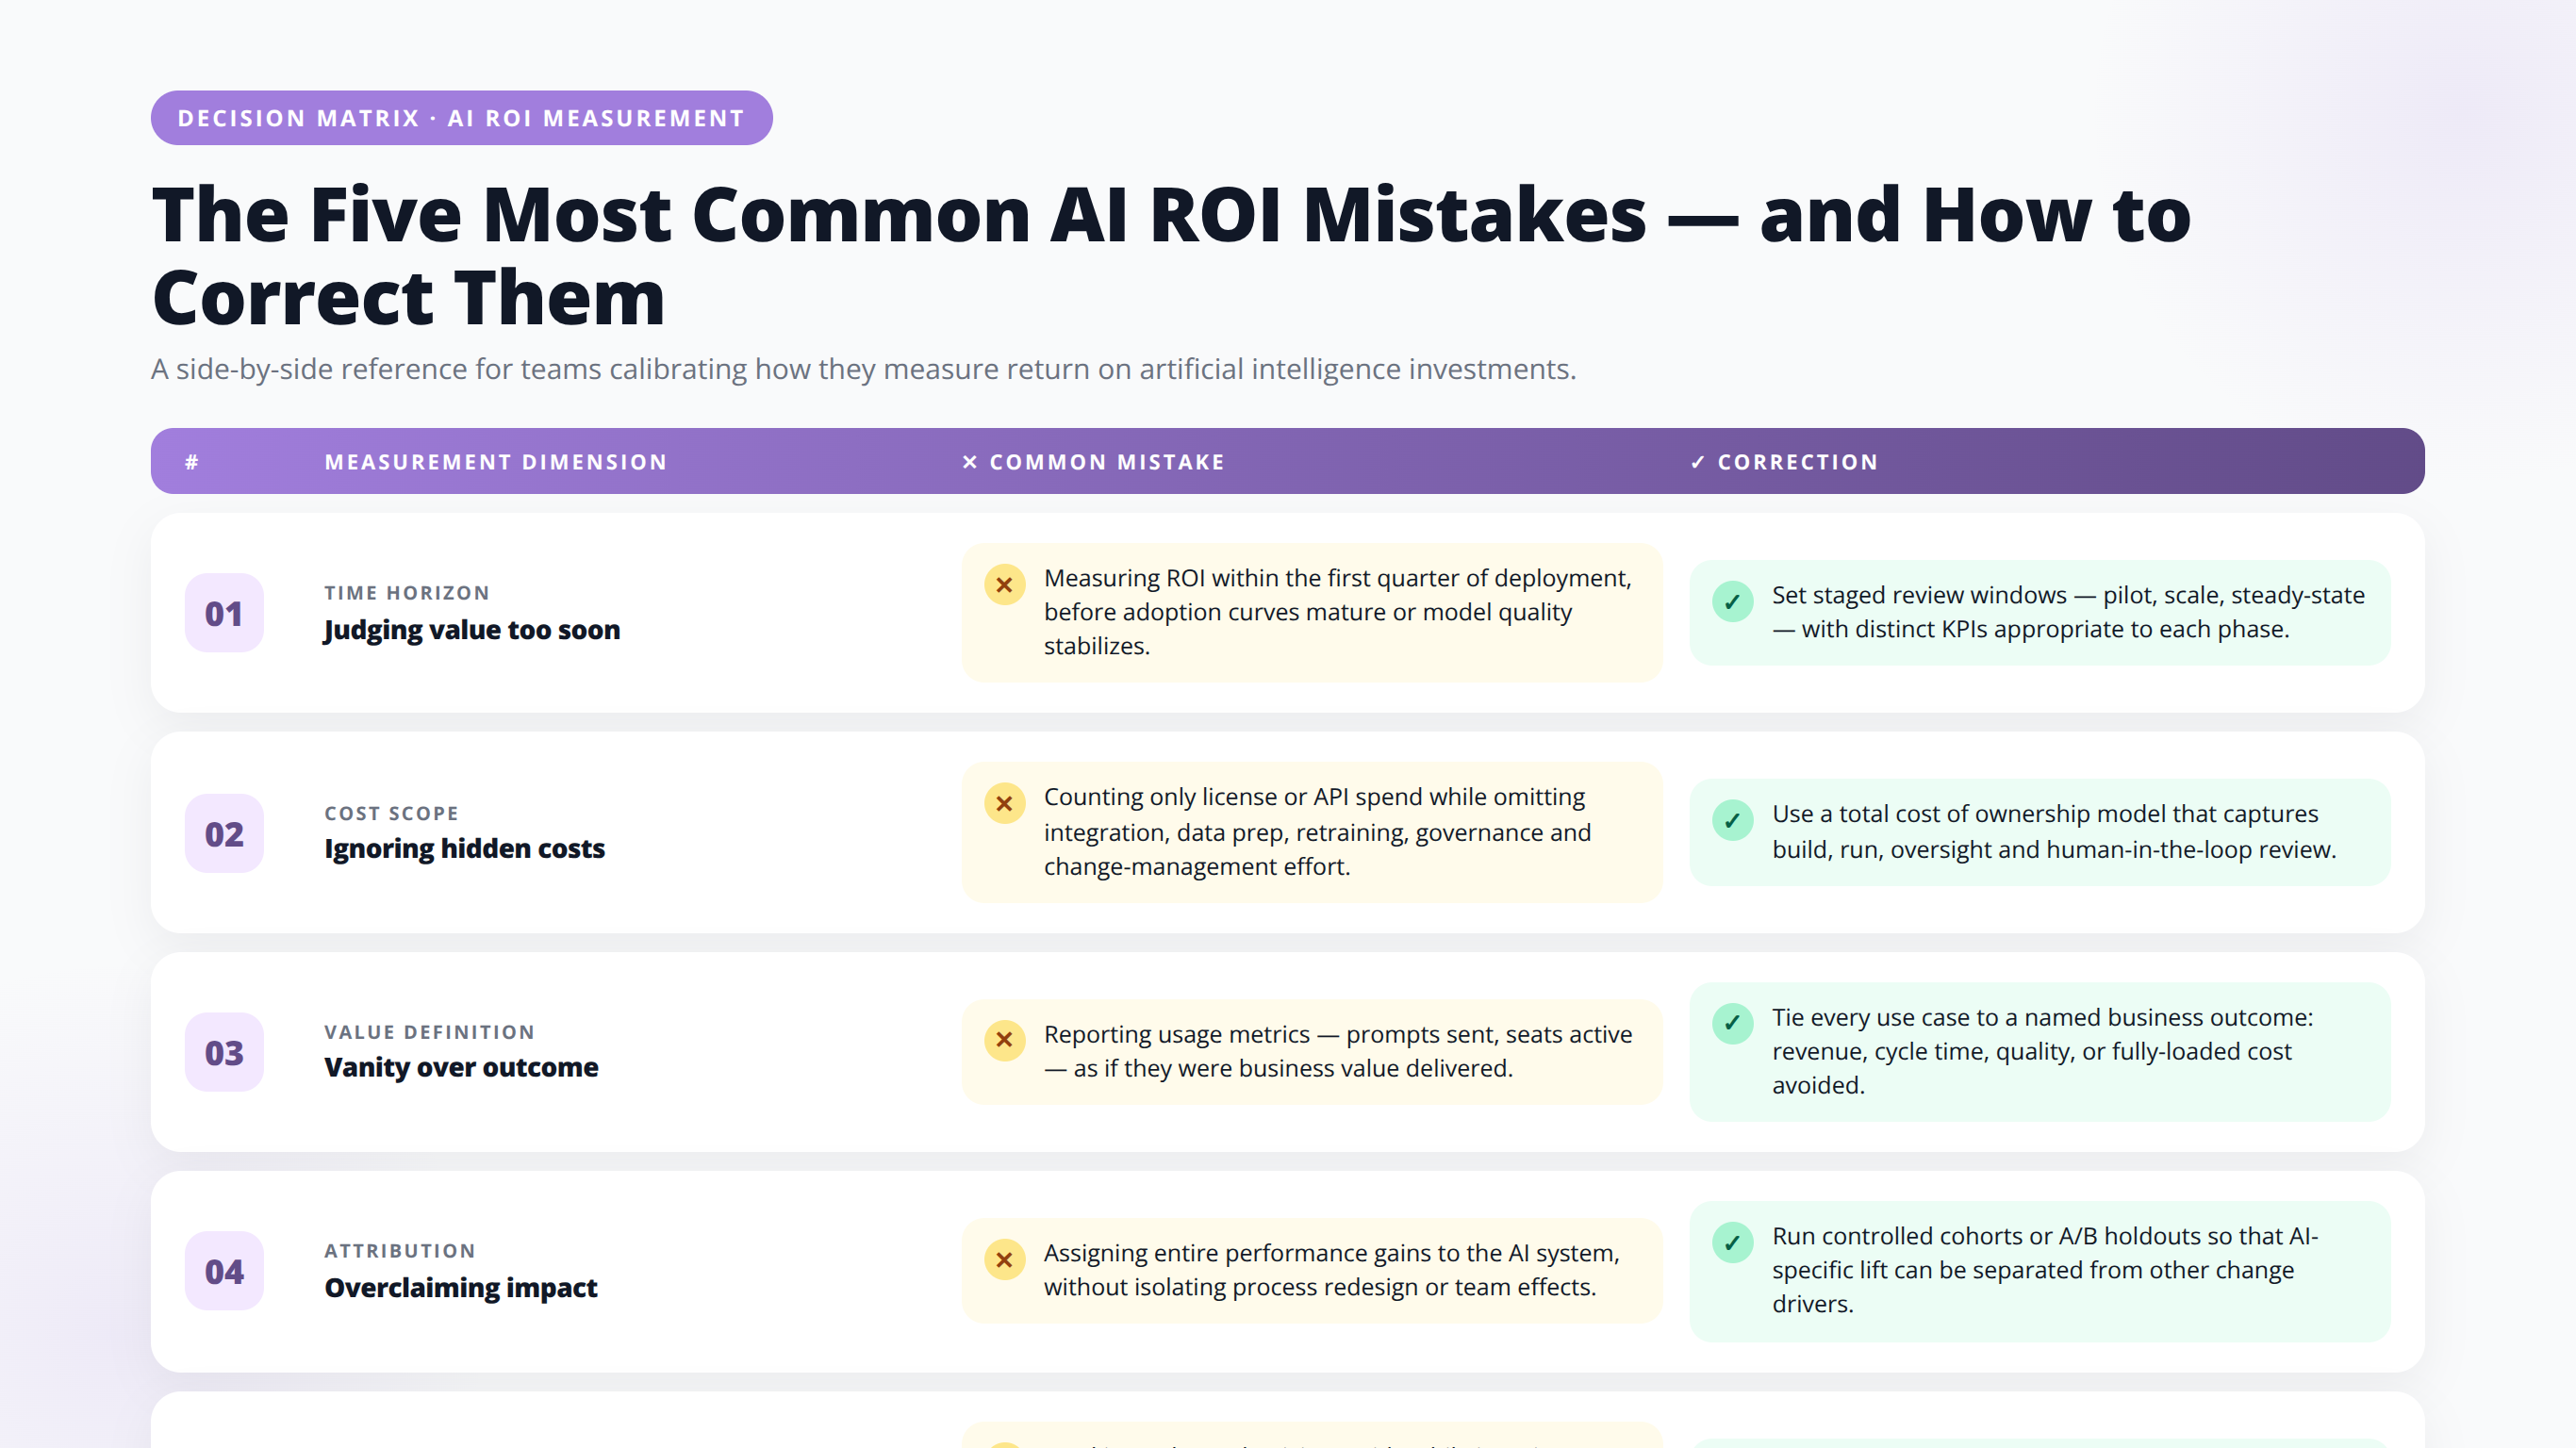
Analyzing the 2026 deployment literature reveals recurring measurement mistakes that undermine credible ROI reporting. Swiss mid-market CEOs should audit their own programs against this list.
Mistake 1: No Pre-Deployment Baseline
The single most common mistake. Without a documented baseline of current cost, time, or output, any "improvement" number is unfalsifiable. Establish baselines before signing the SOW, not after.
Mistake 2: Counting Time Savings as Cash Savings
Hours reclaimed are not francs saved unless the organization actually reduces cost or increases revenue. The conversion mechanism (headcount avoidance, revenue reallocation, capacity redeployment) must be explicit and tracked.
Mistake 3: Ignoring the Total Cost of Ownership
Platform licenses are often less than half of true AI TCO. Integration, data preparation, ongoing prompt engineering, monitoring, and change management typically add 60% to 150% to headline platform costs. Forbes' 2026 advice on cost caps is a direct response to this pattern [Source: https://www.forbes.com/councils/forbestechcouncil/2026/07/23/dont-automate-a-broken-factory-the-mid-markets-real-ai-test/].
Mistake 4: Measuring Once, Then Stopping
ROI is not a one-time measurement. AI performance drifts as data changes, models update, and user behavior evolves. Quarterly re-measurement is the minimum discipline for credible mid-market AI programs.
Mistake 5: Averaging Across Use Cases
A blended "AI ROI" number hides the winners and losers. Each use case should be measured independently so underperformers can be killed and performers can be scaled. Deloitte's finding that only 20% of manufacturing use cases scale [Source: https://www.deloitte.com/ch/fr/Industries/industrial-construction/perspectives/ai-in-manufacturing.html] implies most portfolios have a long tail of use cases that should be retired.
💡 Pro Tip
Create a portfolio-level dashboard that shows each AI use case as a separate row: baseline, current performance, payback status, and a red/amber/green flag. Review it quarterly. Kill red flags after two consecutive quarters. This one discipline separates mid-market AI programs that compound value from those that dissipate it.
The 90-Day ROI Validation Blueprint
Based on the 2026 benchmarks, here is the sequence Swiss mid-market CEOs should follow to validate an AI deployment's ROI within one quarter.
Days 1-15: Baseline Establishment
Timestamp the target workflow. Pull the volume, cost, and cycle-time data from the last 90 days. Document the current close rate, resolution rate, or throughput rate. Get finance to sign off on the baseline numbers before any deployment work begins.
Days 16-45: Pilot Deployment
Deploy to a representative subset (not the star team, not the worst team, the average team). Use production data, not sanitized samples. Track daily. Log every exception and edge case.
Days 46-75: Data Collection
Measure output volume, cost per unit, cycle time, and quality metrics. Compare against baseline. Calculate actual infrastructure spend (opex will surprise you) and log against projections.
Days 76-90: ROI Verification
Run the five-input model with actual numbers. Compare to pre-deployment projections. If the delta is within 25%, proceed to production scaling. If the delta exceeds 40%, reassess before scaling. Present findings to the board with the underlying data attached.
Illustrative Scenario: Mid-Market Zurich Logistics Firm
The following is an illustrative worked example, not a specific client case. Consider a hypothetical 200-employee Swiss logistics company deploying AI to automate customs documentation. Baseline: 45 minutes per shipment, CHF 110 fully loaded labor cost, 800 shipments per month. Deployment cost: CHF 85,000 setup, CHF 4,500 monthly. If the AI reduces handling to 15 minutes, monthly savings equal 400 hours at CHF 110, or CHF 44,000, netting CHF 39,500 after opex. Payback on the CHF 85,000 setup arrives in month three. This is the pattern the 5.8-month benchmark reflects when execution is disciplined.
🧮 Calculate Your AI Automation Payback Period
Interactive tool using the five-input CFO model to project payback for your specific use case.
Open the CalculatorFrequently Asked Questions
What is the average payback period for AI automation in Swiss mid-market companies in 2026?
A: MonteKristo's 2025 production cohort reports an average payback of 5.8 months for mid-market SaaS deployments, with a typical range of 5 to 9 months [Source: https://www.montekristo.co/blog/ai-sales-automation-roi-2026]. Voice-first sales patterns hit break-even earlier at 4.9 months. Manufacturing and operations deployments typically take 9 to 18 months due to integration and scaling complexity.
How many Swiss SMEs have deployed AI in their work processes?
A: According to AXA's SME Labour Market Study 2025 cited by Advanzo, 34% of Swiss SMEs have deliberately integrated AI into work processes, up from 22% the previous year [Source: https://www.advanzo.ch/en-ch/blog/ai-in-sales-2026-numbers-smes]. Switzerland leads the DACH region on this measure, ahead of Austria at 30% and Germany at 26%.
What percentage of Swiss AI adopters actually see time savings?
A: 57% of Swiss SMEs using AI report measurable time gains, according to AXA data cited by Advanzo [Source: https://www.advanzo.ch/en-ch/blog/ai-in-sales-2026-numbers-smes]. That means 43% do not see measurable time savings, usually because the workflow was too low-volume to matter or the AI output required extensive human review before use.
How much do pilot ROI projections typically overstate real production returns?
A: MonteKristo's 2026 analysis finds pre-deployment ROI models overstate returns by 38% to 71% versus eventual production outcomes [Source: https://www.montekristo.co/blog/ai-sales-automation-roi-2026]. The gap comes from cherry-picked pilot data, underestimated infrastructure opex, and adoption rates that fall from 90%+ in pilots to 40%-60% in early production.
What are the five inputs in the CFO-approved AI ROI model?
A: The MonteKristo five-input model requires: meeting or task volume baseline, cost per meeting or task baseline, AI infrastructure capex, AI infrastructure opex, and net delta on close or resolution rate [Source: https://www.montekristo.co/blog/ai-sales-automation-roi-2026]. Every additional variable reduces auditability, so mid-market CFOs prefer this minimal specification.
Why do only 20% of manufacturing AI use cases scale successfully?
A: Deloitte's 2026 AI in Manufacturing report finds that while 84% of manufacturers generate measurable value from AI, only 20% of use cases deploy at scale [Source: https://www.deloitte.com/ch/fr/Industries/industrial-construction/perspectives/ai-in-manufacturing.html]. The bottleneck is operationalization: data infrastructure, multisite integration, change management, and legacy system compatibility, rather than model performance.
How much do sellers actually save using AI-enabled sales tools?
A: HubSpot 2025 benchmark data cited by Advanzo shows 64% of sellers save 1 to 5 hours per week when using AI-enabled tools [Source: https://www.advanzo.ch/en-ch/blog/ai-in-sales-2026-numbers-smes]. At Swiss fully loaded labor rates of CHF 90-140 per hour, a 30-person sales team saving 3 hours per week generates CHF 420,000-655,000 in reclaimed annual capacity.
What is the cost-per-meeting improvement from AI in sales automation?
A: MonteKristo's 2026 benchmark shows 18% to 34% lower SDR cost per qualified meeting when AI is integrated into the outbound stack [Source: https://www.montekristo.co/blog/ai-sales-automation-roi-2026]. The wide range depends on baseline data quality, existing sales tech maturity, and how much of the SDR workflow is genuinely automatable.
How does Switzerland compare to Germany and Austria on AI adoption?
A: Wavect's 2026 DACH benchmark shows 34% deliberate SME AI adoption in Switzerland, 30% in Austria, and 26% in Germany [Source: https://wavect.io/blog/dach-ai-adoption-benchmark-2026/]. Higher Swiss labor costs, tighter labor markets, and stronger digital infrastructure explain the lead, but Wavect warns against averaging these figures with Eurostat series due to methodology differences.
What are the highest-ROI AI use cases for Swiss mid-market companies?
A: Based on 2026 benchmarks: sales automation (5-9 month payback, 18-34% cost improvement), customer service (6-10 month payback, 20-40% deflection), and finance back-office cycle-time reduction (40-70% faster processing). Security operations offer tail-risk ROI with $2.22M per breach avoided [Source: https://app.stationx.net/articles/cybersecurity-spending-statistics].
How should CEOs handle the "time saved isn't cash saved" objection from CFOs?
A: Address it explicitly in the business case. Document the conversion mechanism: headcount avoidance (specific roles not being backfilled), revenue reallocation (freed capacity going to specific revenue activities), or overtime reduction. Track those specific numbers alongside the hours saved. Vague "productivity gains" claims will not survive CFO scrutiny in 2026.
What monthly cost caps should mid-market companies set on AI infrastructure?
A: Forbes' July 2026 mid-market commentary recommends setting strict monthly cost caps before deployment to prevent opex drift [Source: https://www.forbes.com/councils/forbestechcouncil/2026/07/23/dont-automate-a-broken-factory-the-mid-markets-real-ai-test/]. Common practice is capping AI opex at 2x pilot spend for the first six months, with alerts at 75% and hard shutoffs at 100% pending finance review.
How often should Swiss mid-market companies re-measure AI ROI?
A: Quarterly at minimum. AI performance drifts as data changes, models update, and user behavior evolves. Annual measurement is insufficient because underperforming use cases continue consuming budget for too long, and outperforming use cases scale too slowly. Monthly measurement is optimal for the first year of deployment.
What is the biggest predictor of AI ROI success in Swiss mid-market deployments?
A: Data quality. Advanzo's 2026 analysis identifies clean customer data as the biggest ROI lever [Source: https://www.advanzo.ch/en-ch/blog/ai-in-sales-2026-numbers-smes]. Forbes' 2026 mid-market guidance leads with "fix the data foundation" before deployment [Source: https://www.forbes.com/councils/forbestechcouncil/2026/07/23/dont-automate-a-broken-factory-the-mid-markets-real-ai-test/]. AI cannot compensate for missing, inconsistent, or duplicated data.
Should Swiss mid-market companies run pilots or go straight to production deployment?
A: MonteKristo's 2026 guidance strongly favors 90-day pilots over spreadsheet-only planning, specifically because pre-deployment projections overstate returns by 38% to 71% [Source: https://www.montekristo.co/blog/ai-sales-automation-roi-2026]. The pilot must use production-representative data, average performers, and production-priced infrastructure to produce numbers that survive scaling.
What role does change management play in AI ROI realization?
A: Substantial. Adoption rates typically start at 40%-60% in month one and reach 70%-85% by month six only with active change management. The ROI math in most business cases assumes near-full adoption, so weak change management directly reduces realized returns. Budget change management at 15%-25% of total deployment cost.
How do Swiss mid-market boards typically evaluate AI investment proposals in 2026?
A: The dominant pattern is CFO-led scrutiny using payback period as the primary gate. Anything beyond 12 months faces high resistance; 5-9 months is the sweet spot. Boards also increasingly demand sensitivity analysis showing the business case holds when three of five key inputs move against projections by 25%.
What is the difference between deliberate AI integration and shadow AI usage?
A: Deliberate integration means the organization consciously embeds AI into a workflow, with process changes, tool selection, and measurement. Shadow AI is individual employees using consumer tools like ChatGPT without organizational sanction. The AXA 34% figure counts only deliberate integration [Source: https://www.advanzo.ch/en-ch/blog/ai-in-sales-2026-numbers-smes]. Shadow AI produces no measurable organizational ROI.
Conclusion
Swiss mid-market AI automation ROI in 2026 has matured into a discipline with defensible benchmarks, standard measurement frameworks, and clear failure modes. The companies capturing real returns are the ones treating AI investments with the same rigor as any other capital allocation decision.
Key Takeaways
- 34% of Swiss SMEs now deliberately integrate AI, with 57% reporting measurable time savings
- Average payback for mid-market SaaS deployments is 5.8 months, with sales automation leading and manufacturing lagging
- Cost per task or per booked meeting is the most defensible unit economic, with 18%-34% improvements benchmarked in sales
- The five-input CFO ROI model (volume, unit cost, capex, opex, quality delta) has become the mid-market standard
- Pilot projections overstate real returns by 38%-71%, making 90-day production-representative pilots essential
- Only 20% of manufacturing AI use cases scale successfully, making operationalization the biggest ROI risk
- Data quality, not model sophistication, is the biggest predictor of ROI success
The Swiss mid-market AI conversation has moved past "can it work?" and into "how do we prove it did?" CEOs who bring finance-grade measurement discipline to their AI programs will separate signal from noise, kill underperforming use cases quickly, and scale winners with confidence. The benchmarks in this article give you the reference numbers to hold your programs accountable to.
📅 Schedule a Swiss AI ROI Audit
Two-hour executive session to benchmark your current AI investments against 2026 mid-market standards.
Book Your ROI Audit
About the Author
Agenticsis Team — Zurich-based AI consultancy founded by Sofía Salazar Mora, partnering with companies across Switzerland, the European Union, and Latin America to mainstream artificial intelligence into business operations. Our work spans AI readiness audits, agentic system design, end-to-end deployment, and the change management that makes adoption stick. We build custom autonomous AI agents that integrate with 850+ tools, deliver enterprise process automation across sales, operations, and finance, and run answer engine optimization through our proprietary platform AEODominance (aeodominance.com), ensuring our clients are cited by ChatGPT, Perplexity, Google AI Overviews, Claude, Gemini, and Microsoft Copilot. Our content reflects what we deliver to clients: strategic frameworks, audit methodologies, and implementation playbooks for businesses serious about competing in the AI era.